
Improving Macroeconomic Governance through Balance Sheet ManagementBy
Author: ZHANG Xiaojing and LIU Lei
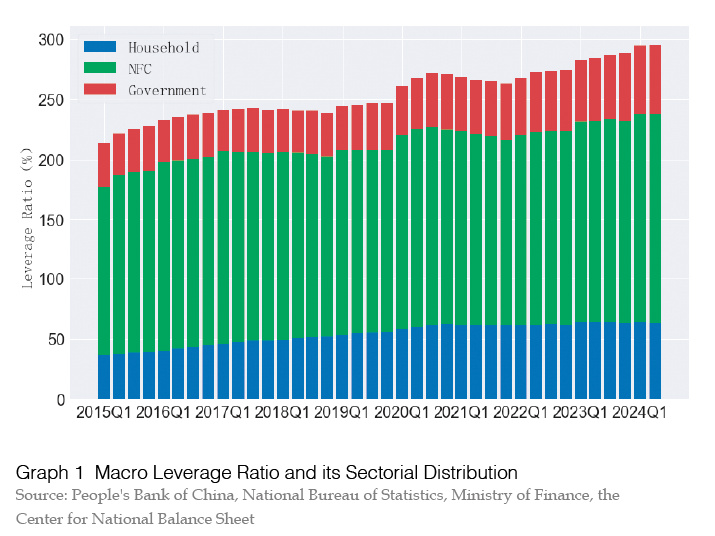
China's macro leverage ratio increased by 0.8 percentage points in the second quarter of 2024, from 294.8% at the end of the first quarter to 295.6%. Among them, the household sector leverage ratio decreased by 0.5 percentage points, dropping from 64.0% in the first quarter to 63.5%; the leverage ratio of the non-financial corporate (NFC) sector increased by 0.2 percentage points, rising from 174.1% at the end of the first quarter to 174.3%; the government sector leverage ratio increased by 1.1 percentage points, rising from 56.7% at the end of the first quarter to 57.8%. The M2/GDP ratio fell by 2.1 percentage points, from 239.5% at the end of the first quarter to 237.4%; the social financing stock/GDP ratio increased by 0.8 percentage points, from 306.7% at the end of the first quarter to 307.5%.
In the first half of the year, China's macro leverage ratio increased by 7.5 percentage points, driven mainly by a 5.9 percentage point rise in the NFC sector and a 1.6 percentage point rise in the government sector.
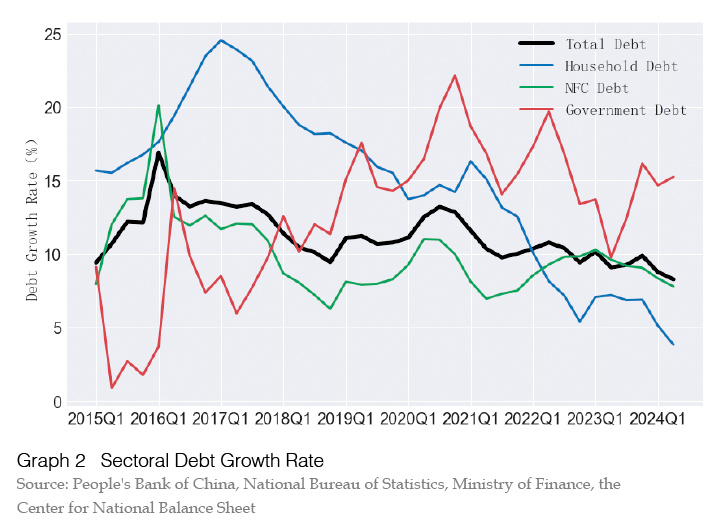
In the second quarter of 2024, debt growth continued to decline, with YoY growth rate falling to 8.3%, the lowest level since 2001. Correspondingly, the growth rate of M2 fell to 6.2%, the growth rate of M1 was -5.0%, and the growth rate of social financing was only 8.1%. Among the debt in the real economy, YoY growth rates for household, NFC, and government debt were 3.8%, 7.8%, and 15.2%, respectively. Household debt growth reached a new low; NFC sector debt growth continued to decline; government debt growth remained relatively high. Despite the continued decline in loan interest rates, both households and NFC showed limited willingness to leverage.
Although government debt continued to rise in the second quarter, it was still insufficient to offset the decline in private sector debt growth, resulting in to a continued decline in total debt growth.
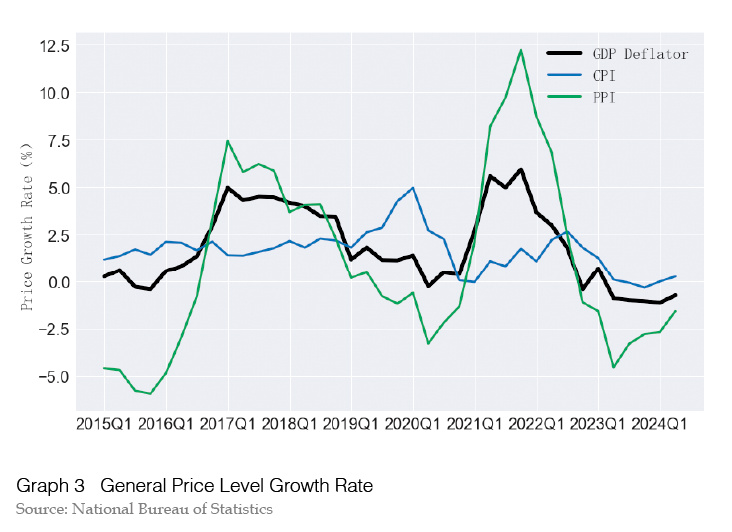
Alongside the decline in debt growth, nominal GDP growth also declined. The actual GDP growth in the second quarter was 4.7%, but nominal GDP grew by only 4.0%. The nominal GDP growth rate has been below the actual GDP growth rate for five consecutive quarters. The macro leverage ratio is the ratio of an economy’s debt scale to nominal GDP scale. As long as the debt growth rate is above the nominal GDP growth rate, the macro leverage ratio will rise, regardless of how the debt growth rate decreases. In the first half of this year, the actual GDP growth rate was 5.0% and nominal GDP growth rate was 4.1%. As long as the debt growth rate remains above 5%, the macro leverage ratio can only passively increase.
The difference between the nominal GDP growth rate and the actual GDP growth rate, known as the GDP deflator, was -0.7% in the second quarter. Since the fourth quarter of 2022, only the first quarter of 2023 has had a positive GDP deflator; all other periods have been below 0. Both CPI and PPI YoY growth rates recovered somewhat, with average CPI growth stood at 0.3% in the second quarter, and average PPI growth stood at -1.6%. The downward trend in price levels has slowed.
This period of negative price growth has lasted for six quarters, marking a significant deflationary trend in recent years.In 2023, China's macro leverage ratio increased by a total of 13.7 percentage points, up 9.7 percentage points in the first half of the year. The rate of increase in macro leverage ratio has slowed this year, rising 7.5 percentage points in the first half of the year. The willingness of households and NFC to leverage up has declined compared to last year. Although economic growth has slowed, debt growth has slowed even further, leading to a passive increase in the leverage ratio. We expect the annual increase in the macro leverage ratio to be less than in 2023, with a total increase of about 10 percentage points.
Household Leverage Ratio Unchanged in the First Half of the Year
In the second quarter of 2024, the leverage ratio of the household sector decreased by 0.5 percentage points, from 64.0% at the end of the first quarter to 63.5%. Household leverage ratio remained unchanged in the first half of the year. In May, regulators adjusted home loan policies, lowering mortgage rates. Housing transaction volumes increased slightly, but mortgage demand remained low. Household loan growth fell to an all-time low, and household leverage ratio also declined.
The growth rate of total household loans fell to 3.8%, while the growth rate of consumer loans (including mortgages and general consumer loans) fell to 0.7%. Mortgage growth in the first quarter was -1.8%, while other consumer loans grew 8.4%. Consumer loan growth continues to decline, and mortgage growth has been negative for six consecutive quarters since the first quarter of 2023. The growth rate of personal business loans also declined gradually, with a YoY growth rate of 12.2% in the second quarter.
In the first half of 2024, disposable income per capita nationwide reached 20,733 yuan, an increase of 5.4% over the same period in 2023. Per capita income growth continued to outpace nominal GDP growth. Household income grew by 5.8%, business income by 6.4%, and property income by 2.1%. Household income growth outpaced GDP growth, increasing disposable income’s share of total income. In the first half of the year, per capita consumption expenditure of households reached 13,601 yuan, representing a 6.8% increase from the same period in 2023. The growth rate of household consumption expenditure exceeded the growth rate of disposable income, and the growth rate of disposable income outpaced the growth rate of total income. The household savings rate declined, with the savings rate in the first half of the year falling to 34.4%, lower than both the savings rate in the first quarter and the same period last year, indicating that household consumption contributed to economic growth to some extent.
By the end of the second quarter of 2024, household deposits had reached 147.2 trillion yuan, an increase of 9.3 trillion yuan from the end of 2023. The first quarter saw an increase of 8.6 trillion yuan, but the second quarter's increase was only 735.2 billion yuan. On the one hand, the decline in new debt naturally led to a decline in the total amount of new bank deposits across all sectors. At the end of the second quarter, total scale of deposits at financial institutions increased by only 266.6 billion yuan from the end of the first quarter. On the other hand, the decline in the household savings rate has reduced the sources of funds for new household deposits. This resulted in a slight decrease in the ratio of household deposits to GDP from 115.1% at the end of the first quarter to 114.6% at the end of the second quarter. It is expected that the growth rate of household deposits will increase significantly in the second half of the year, with the total increase in household deposits for the year expected to exceed 15 trillion yuan.
NFC Leverage Ratio Slightly Increased
In the second quarter of 2024, the NFC leverage ratio increased from 174.1% at the end of the first quarter to 174.3%, an increase of 0.2 percentage points. Total growth for the first half of the year was 5.9 percentage points. After a significant rise in the first quarter, NFC leverage ratio remained relatively stable in the second quarter. Policy interest rates remained stable at low levels during the second quarter, with relatively abundant liquidity and ample capital supply, but NFC debt demand remained limited, with debt growth below 10% for several years. The "water drain" in finance, which included measures such as limiting manual subsidies by commercial banks, also played a role in reducing corporate loan growth. Corporate demand for current deposits declined sharply, reflecting a lack of investment demand. Although new growth drivers in the economy maintained rapid growth, the significant decline in real estate investment left a large gap, affecting investment and financing demand in related industries.
In the second quarter of this year, all policy interest rates remained unchanged. In the first quarter, only the five-year Loan Prime Rate (LPR) was reduced by 25 basis points. The reserve requirement ratio (RRR) for financial institutions was lowered by 0.5 percentage points in the first quarter. Overall, interbank market interest rates remained stable and relatively low in the second quarter. Compared to the fourth quarter of last year, mortgage and corporate loan rates decreased in the first quarter of this year, with the weighted average mortgage rate for personal home loans falling to 3.69% and the weighted average corporate loan rate at 3.73%, very close to the five-year LPR rate of 3.95%.
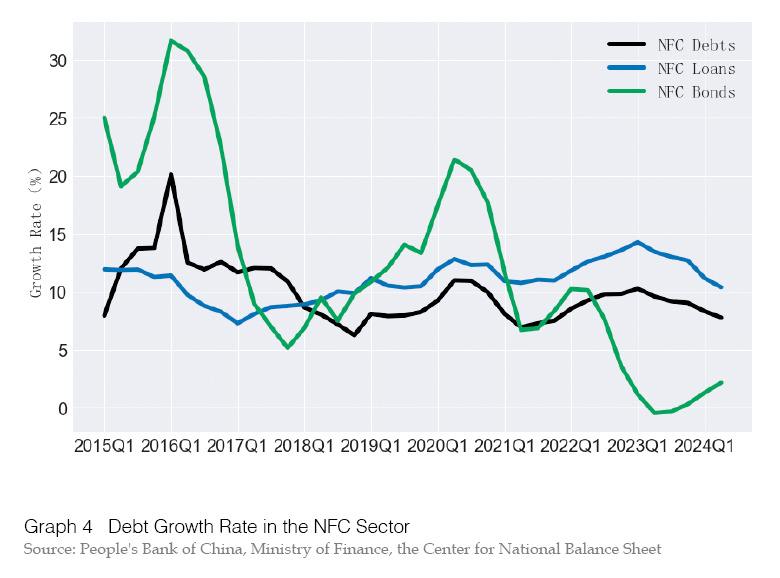
Despite low interest rates, the growth rate of corporate loans continued to decline. By the end of the second quarter, the YoY growth rate of corporate loans fell to 10.4%, and the growth rate of corporate debt dropped to 7.8%. Although the cost of financing for enterprises has decreased, demand for loans has remained weak. Since the beginning of this year, in response to the central government's call to revitalize existing assets and prevent capital from being idle, the slow growth in corporate debt reflects the impact of the "water drain" policy. In recent periods, a significant portion of the growth in corporate debt was due to idle capital, where corporate loans were converted directly into deposits without stimulating investment, leading to synchronized growth in loans and deposits but not impacting the real economy. The implementation of a series of policies in the second quarter aimed at curbing the manual subsidy of interest by commercial banks and other measures to govern idle capital has reduced the scale of idle capital, "water drain" from financial data, and lowering the growth rate of corporate debt (especially corporate loans), thus reducing the upward trend in the corporate leverage ratio. However, the financing demand in some parts of the corporate sector remains weak, while capital supply is abundant, indicating that there is still some "water" in corporate debt, and efforts to revitalize existing assets will continue.
Corporate deposits showed a decline in growth during the second quarter, particularly in demand deposits, reflecting reduced investment demand. This indicates that, in the short term, the corporate sector does not have a clear need for funds, leading to a decrease in the proportion of demand deposits.
In the first half of this year, corporate fixed asset investment grew by 3.9% YoY, with infrastructure investment up 7.7%, manufacturing investment up 9.5%, and real estate investment down by 10.1% YoY. Investment growth slowed compared to the first quarter, returning to a relatively low level, similar to last year, and below nominal GDP growth rate. Real estate investment has been in negative growth for two consecutive years. In the first half of the year, the value added of the real estate industry fell by 8.15% YoY. The share of the real estate industry's value added in GDP peaked at 7.2% in 2020 and has since been declining, reaching 5.8% in the first half of this year.
The bright spots in the economy continue to be high-tech industries and advanced manufacturing, which are growing rapidly. The nominal value-added of the information transmission, software, and information technology services industry grew by 11.3% YoY in the first half of the year, following growth of 11.1% and 11.6% in the past two years, respectively. The value added of the accommodation and catering industry grew by 7.9% in the first half of the year, continuing to maintain a high growth rate on the basis of last year's high base. It is clear that the biggest challenge currently facing China's economic growth is the real estate sector and its related industries. The decline in the growth rate of the real estate sector and its shrinking share of GDP are due to both structural factors and the impact of cyclical economic fluctuations in the short term. The slowdown in real estate growth has significant spillover effects on other related industries, including construction, retail, and certain manufacturing sectors. Private investment grew by only 0.1% YoY, well below the overall growth rate of fixed asset investment. However, excluding real estate investment, private investment grew by 6.6%, remaining relatively stable.
Stabilizing economic growth requires stabilizing the real estate sector to avoid a rapid downward trend. More importantly, accelerating the growth of strategic emerging industries is crucial to filling the gap left by the decline in the real estate sector.
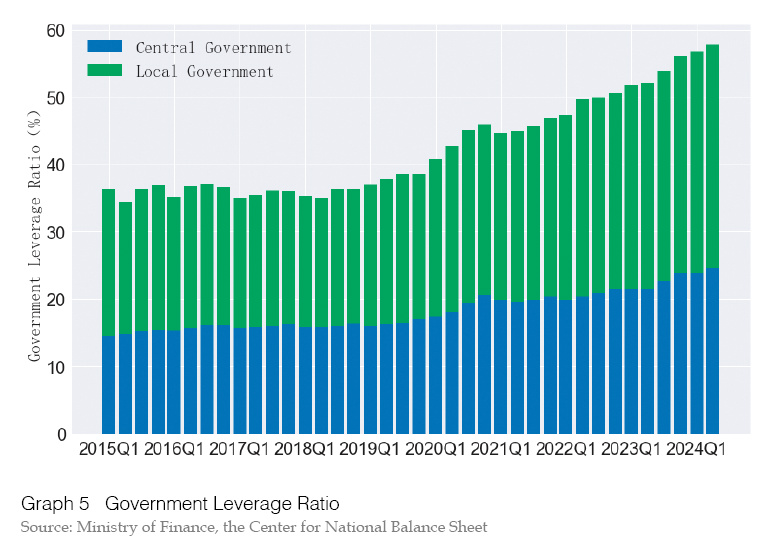
Government Leverage Ratio Continues to Rise
In the second quarter of 2024, the leverage ratio of the government sector increased from 56.7% in the first quarter to 57.8%, an increase of 1.1 percentage points. The central government leverage ratio rose from 24.0% to 24.6%, an increase of 0.6 percentage points, while the local government leverage ratio rose from 32.7% to 33.2%, an increase of 0.5 percentage points. For the first half of the year, the central government leverage ratio increased by a total of 0.76 percentage points, and the local government leverage ratio by 0.85 percentage points, resulting in a total increase of 1.6 percentage points in the government leverage ratio. The scale of the increase in government debt limits for 2024 is 280 billion yuan higher than last year, with the central government increasing by 180 billion yuan and local government special bonds increasing by 100 billion yuan. However, considering that the actual increase in local government debt last year far exceeded the increase in the debt limit, the scale of government debt increase this year is expected to be smaller than last year. The government leverage ratio is expected to continue to rise in the second half of the year.
Based on the 2023 fiscal budget and the October adjustment plan, the central government debt was planned to increase by 4.16 trillion yuan, and the actual increase matched this amount. For 2024, the planned annual increase in general treasury bonds is 3.34 trillion yuan, with an additional 1 trillion yuan in ultra-long-term special treasury bonds, totaling 4.34 trillion yuan, which is 180 billion yuan higher than in 2023. The 2023 budget planned a 720 billion yuan increase in local government general debt, but the actual increase was 1.48 trillion yuan, reducing the gap between the debt limit and the actual balance to 680 billion yuan. For 2024, the planned increase remains 720 billion yuan. Additionally, local government special debt was planned to increase by 3.8 trillion yuan in 2023, but the actual increase was 4.2 trillion yuan. For 2024, the planned increase is 3.9 trillion yuan, which is 100 billion yuan more than the 2023 budget.
In 2023, the increase in treasury bonds and government debt was concentrated in the second half, with central government debt rising by 3.45 trillion yuan and the leverage ratio increasing by 2.3 percentage points. Local government general debt increased by 1.0 trillion yuan in the second half, largely due to special refinancing bonds. In the first half of 2024, central government debt grew by 1.55 trillion yuan, and local government general debt rose by 487.3 billion yuan, both slightly higher than the previous year. However, local government special debt increased by only 1.39 trillion yuan, lower than the first half of 2023, due to slower bond issuance and limited investment areas. A gap of 750 billion yuan remains between the debt limit and actual special bond balances, with a likely peak in issuance expected in the third quarter of 2024.
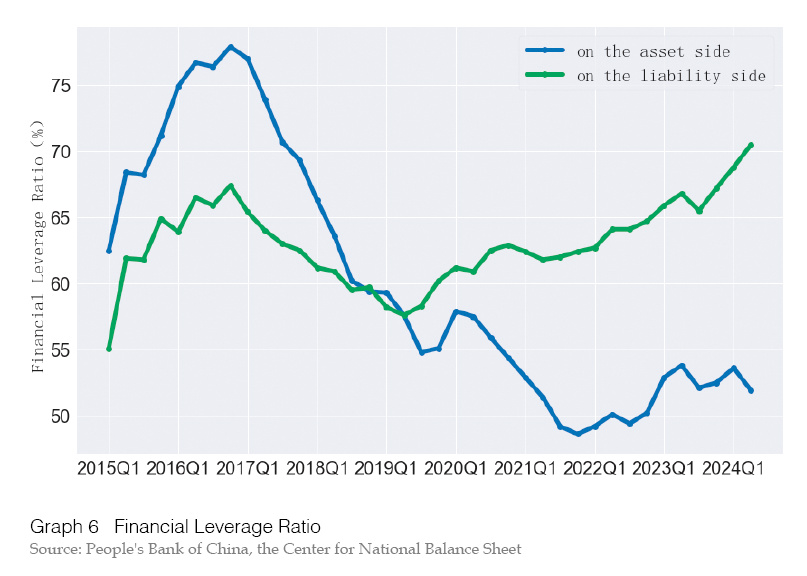
Financial Leverage Trends Diverge
In the second quarter of 2024, the financial leverage ratio, measured on the asset side, decreased from 53.6% at the end of the first quarter to 51.9%, a drop of 1.7 percentage points. On the liability side, the financial leverage ratio increased from 68.8% at the end of the first quarter to 70.5%, an increase of 1.7 percentage points. In the first half of the year, the financial leverage ratio on the asset side fell by a total of 0.7 percentage points, while on the liability side, it increased by 3.2 percentage points. On the asset side, the scale of lending by the banking system to the outside world was relatively small due to insufficient demand from the real economy. Demand for bank funds from various non-bank financial institutions was also limited. On the liability side, the deposit scale of non-bank financial institutions increased, and liquidity was relatively ample, but institutions' risk appetite declined, leading to a significant inflow of funds from non-bank financial institutions into banks, resulting in a continuous increase in the financial leverage ratio on the liability side.
Since the second quarter of 2023, the rate of expansion of bank balance sheets and M2 has begun to decline. Three cuts since 2023 have reduced the reserve requirement ratio by a total of 100 basis points, releasing approximately 2 trillion yuan of liquidity, slowing the rate expansion of bank balance sheets. Growth rates for bank loans, corporate bonds, and off-balance-sheet assets were all relatively low, contributing to the lower growth rate for total bank assets and M2.
The proportion of interbank debt in total assets declined slightly compared to the first quarter, and the proportion of funds provided by commercial banks to shadow banks in total assets also declined significantly. After 2016, during the financial deleveraging process, these two proportions experienced a significant downward trend. Affected by the decline in demand from the real economy, these proportions continued to decline in the second quarter.
Improving Macroeconomic Governance through Balance Sheet Management
The Resolution of the Central Committee of the Communist Party of China on Further Deepening Reform
Comprehensively to Advance Chinese Modernization adopted at the third plenary session of the 20th Central Committee of the Communist Party of China calls for “explore the introduction of national macro balance sheet management” and “improving the allocation of newly acquired resources and adjusting the mix of existing resources”. The national balance sheet is a comprehensive measure of a country's economic strength, showing the scale of assets and liabilities in various sectors, the structure of assets and liabilities, and the interconnections of assets and liabilities between sectors. Macro equity structure management based on the national balance sheet is a key link to improving the macroeconomic governance system and contains rich means of regulation and management. To improve macroeconomic governance through balance sheet management, there are three important points to follow.
First, the national macroeconomic balance sheet reflects the accumulation of net wealth in various sectors, especially the accumulation paths of household and government wealth. The report of the 20th National Congress emphasizes the need to regulate the mechanisms of wealth accumulation, which is the guarantee for achieving high-quality development and common prosperity. It requires household disposable income to grow faster than total income and household wealth to grow faster than government wealth. Based on a high household savings rate, the growth rate of net wealth in Chinese households has long outpaced overall growth. Recent trends show an increase in household net financial assets due to rising deposits and declining debt, although fluctuations in real estate values have impacted consumption. Therefore, macroeconomic balance sheet management must aim to stabilize the value of residential assets and avoid the risk of a balance sheet recession.
Second, the national macroeconomic balance sheet reflects the unique characteristics of China's financial structure, showing the extent of financial support for the real economy. China has a banking-dominated and indirect financing-oriented financial system, with a relatively high proportion of deposits and loans on the national macroeconomic balance sheet, while the proportion of securities investment funds and other financial derivatives is relatively low. This financial structure is conducive to mobilizing funds through banking institutions for large-scale economic construction in key areas, concentrating resources for production activities throughout society. However, the lagging development of capital markets has also hindered investment in riskier and more innovative areas. Macro management based on the national balance sheet can scientifically adjust the financial system’sstructure, effectively leverage financial resources to support the development of strategic emerging industries, particularly the development of new types of productive forces.
Third, the national macroeconomic balance sheet reflects the scale and structure of liabilities in various sectors, with macro leverage ratio being a core indicator of systemic financial risk. Currently, China's macro leverage ratio has exceeded that of major economies. Since 2021, major economies have experienced a deleveraging cycle, with leverage ratios in both the private and government sectors declining. G20leverage ratios have collectively decreased by nearly 50 percentage points, while China's macro leverage ratio continues to rise. The main reason for this divergence is the different inflation trajectories. After the pandemic, China's price levels have been sluggish, with GDP deflator negative for six months, while developed economies are experiencing a prolonged period of high inflation. Increasing countercyclical adjustments and raising inflation rates would not only enhance corporate earnings and stimulate economic growth, but would also help ease the rapid rise in macro leverage ratio and reduce financial risks.
ZHANG Xiaojing is a Professor of Economics and the Director of National Institution for Finance & Development, Chinese Academy of Social Sciences (CASS)
LIU Lei is an associate professor and a Senior Researcher of the Center for National Balance Sheet, Chinese Academy of Social Sciences (CASS)

